Running a startup means you’re moving fast, and sometimes, things break. If your WordPress site suddenly throws a white screen, a weird error message, or just isn’t behaving, your first thought might be, “Panic!”
But hold on! Before you call in an expensive expert, there’s a powerful tool built right into WordPress that can tell you exactly what’s wrong: WordPress Debug Mode.
As a web maintenance and error-fixing WPErrorFixer, we know that debugging is the essential first step to solving any problem. Here’s a simple breakdown of what debug mode is, how to turn it on safely, and our best advice for using it.
What Exactly Is WordPress Debug Mode?
Think of your website as a complex machine. When it breaks, Debug Mode is like the machine’s internal diagnostic system.
Normally, WordPress keeps its internal errors hidden from your visitors (which is good!). Debug Mode, however, forces WordPress to:
Display all PHP errors, warnings, and notices that are happening in the background.
Log these issues to a special file on your server.
This gives you (or your maintenance partner, like WPErrorFixer) the crucial clues needed to pinpoint the exact plugin, theme, or line of code that is causing the trouble. It turns a vague “something is wrong” into a specific, actionable fix.
How to Enable Debug Mode (The Easy Way)
You enable debug mode by editing one simple file: the wp-config.php file. You’ll need access to your site’s files, usually through your hosting provider’s File Manager or an FTP client.
Step-by-Step Guide:
Locate the File: Find the
wp-config.phpfile in the root folder of your WordPress installation.Open and Find: Open the file for editing. Scroll down until you find this line (it’s usually near the end, just before a comment that says “That’s all, stop editing!”):
define( 'WP_DEBUG', false );
Turn it ON: Change the word
falsetotrue.define( 'WP_DEBUG', true );
Best Practice: Always Log Errors, Don’t Display Them
If you only use the line above, the errors will show up on the front of your website—which looks unprofessional to visitors! The WPErrorFixer best practice is to always log the errors without displaying them publicly.
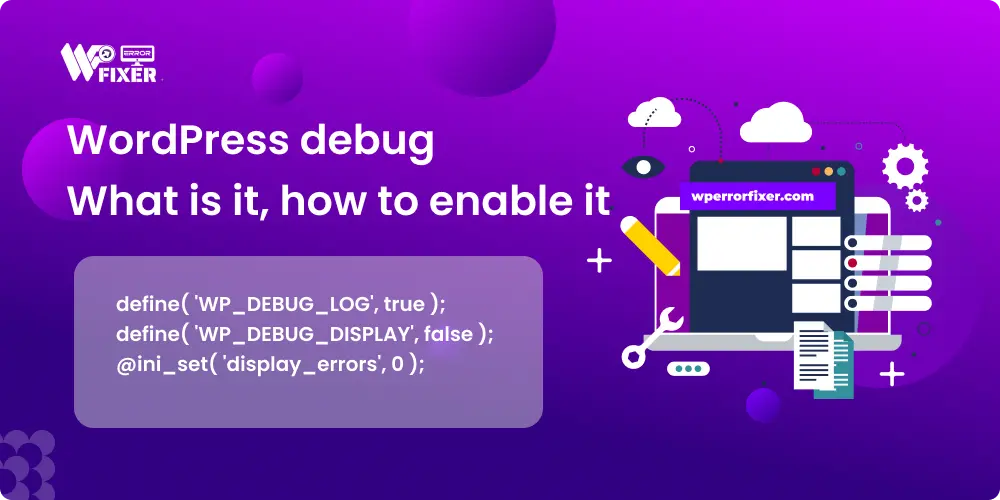
Add these two lines after the WP_DEBUG line you just changed:
define( 'WP_DEBUG_LOG', true );
define( 'WP_DEBUG_DISPLAY', false );
@ini_set( 'display_errors', 0 );
| Setting | What It Does |
WP_DEBUG_LOG, true | Tells WordPress to save all errors to a file called debug.log inside the /wp-content/ folder. This is your diagnostic report. |
WP_DEBUG_DISPLAY, false | Keeps the error messages hidden from public view. |
Save the File: Save your changes and upload the updated
wp-config.phpfile back to your server.
Best Practices After Enabling Debug
You’ve turned it on. Now what?
1. Recreate the Error
Visit the page or perform the action that was causing the problem (e.g., try to save a post, visit the homepage, or submit the broken form). This ensures WordPress logs the specific issue you’re trying to fix.
2. Check the Log File
Head to the /wp-content/ folder on your server and look for the new file named debug.log. Open it up.
Inside, you’ll see a list of issues. Look for lines that start with words like Fatal Error or Warning. They usually include a path that tells you the exact theme or plugin folder causing the problem.
3. The Golden Rule: Turn it OFF!
This is critical. Debug Mode is a heavy process and should never be left enabled on a live, production website.
Once you have your clues, go back to your wp-config.php file and set the primary line back to false:
define( 'WP_DEBUG', false );
Then, you can either tackle the identified problem yourself (by updating or replacing the faulty plugin) or, if the code fix is too complex, send the contents of your debug.log file to a service like WPErrorFixer for a fast, targeted solution!
Debugging is the smartest, most efficient way to maintain a healthy website and save your startup valuable time and money.